Memproof - Find memory and resource leaks
- Date:
- Author: Stefan Cruysberghs
MemProof is one of the best heap memory and resource 'leaks' debugger - this means the MemProof will help you find pointers and other various resources that you allocate but forget to free. MemProof does its job by launching the main EXE file in debug mode and hooking the allocation and deallocation calls made by the program. For each allocation type, MemProof maintains a counter that it increments when you allocate the resource and decrements when you free the resource.
MemProof, written by Atanas Stoyanov, is and will be geared specifically for Delphi/C++Builder developers. The current version of MemProof is free to use.http://www.automatedqa.com
Getting started
To prepare a Delphi 6 application for debugging under MemProof, please follow those steps :
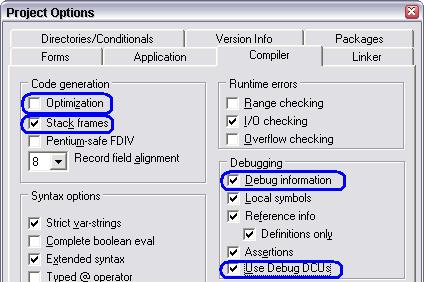
1. Project >> Options >> Compiler Uncheck the option Use Debug DCU’s after using MemProof. This option will use the Delphi DCU’s with extra debug information in Delphi6\Lib\Debug.
2. Project >> Options >> Linker
In order to debug your project with MemProof, you need to link Turbo Debugger Symbol information into your EXE file. So go to the tabsheet Linker and check the option Include TD32 debug info. Be aware that this will add all source into the EXE and this will make your exe file approximately twice as large. So make sure this checkbox is unchecked after using MemProof.

3. Compile application
4. Launch MemProof and test EXE.
Start MemProof from the main screen click Open and select the produced EXE file. Click Run (the green arrow). Execute your application as usual and perform the actions that you suspect are causing the leaks. Exit your application and MemProof will show you a report of the leaks and errors.
Interface of MemProof
Resource Counters
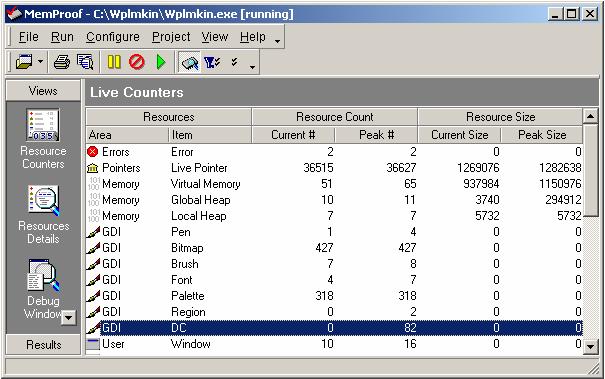
The Resource Counters page shows the current and peak values of the allocated resources.

- Area is a group of allocations. Often used are the Live Pointer, the GDI,USER and KERNEL subsystems of Windows etc.
- Item is a an allocation that is part of the group. For Example Pens and Brushes are items and are part of the GDI area.
- Current # the current number of items allocated at the given time. MemProof updates its counters all the time to show an accurate picture of the allocated items.
- Peak # the highest (peak) number of items allocated during the whole run of the application. This number can help you find items that are not real leaks, but are rather overused by your application.
- Current Size and Peak Size are similar to the above counters, but they represent the size in bytes of the resource. Keep in mind that only certain items have a size representation - usually the memory allocations. Other resources do not have a size - for them only the numbers are important.
Resources Details
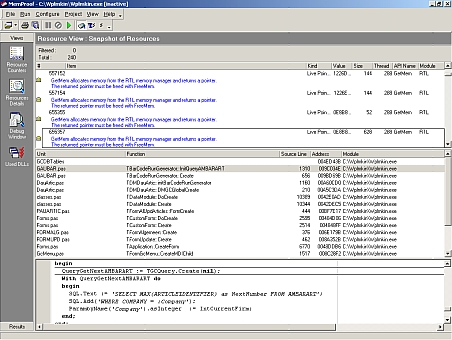
The Resources Details page shows a detailed list of allocated resources. For each resource, you will see the call stack that led to the allocation of this resource. When you select a call stack line, and if the source code file is in your Search Path, MemProof will display the source code in a syntax colored editor. You have to trace into the source until you see the Delphi VCL units.
To browse into your source you have to add the paths to the source folders. Go to Configure >> Search directories and add the paths.
Used DLL’s
The Used DLL’s page shows you all DLL’s (Dynamic Loaded Library) which are statically linked as well as dynamically loaded via LoadLibrary.
Resource leaks
Resources refer to allocations that do not have a size property. For resources only the number (count) is important - for example if you open a file, you should also close this file, the size of the file is not important.
Solving GDI (Graphical Device Interface) resource leaks is not so easy. In most cases these leaks are caused because some information of bitmaps is not cleared in the memory. This can occur when using the Assign method. At some extra lines to solve this :
Bitmap.Dormant;
Bitmap.FreeImage;
Bitmap.Width := 0;
Bitmap.Assign(BitmapTemp);var
BitmapTemp : TBitmap;
begin
BitmapTemp := TBitmap.Create;
try
...
Bitmap.Dormant;
Bitmap.FreeImage;
finally
BitmapTemp.Free
end;
end;
Memory leaks
It is very important to solve memory leaks ! In MemProof you have the check the Live pointers. You should always try to fix those memory leaks first.
Use the function FreeAndNil when freeing global objects. When using Free the object and its memory will be freed, but a pointer still exists. This is not a problem but debugging tools like MemProof do not know the difference. So to avoid a lot of reported existing live pointers use FreeAndNil or object.Free and object := nil
Implementation of FreeAndNil in Delphi unit SysUtils :
procedure FreeAndNil(var Obj);
var
  Temp: TObject;
begin
  Temp := TObject(Obj);
  Pointer(Obj) := nil;
  Temp.Free;
end;var
SLTemp : TStrings;
begin
SLTemp:= TStringList.Create;
try
...
finally
SLTemp.Free;
end;
end;var
PtrBookmark: TBookmark;
begin
with CDSCustomers do
begin
PtrBookmark := GetBookmark;
try
...
GotoBookmark(PtrBookmark);
finally
FreeBookmark(PtrBookmark);
end;
end;
end;To find memory leaks go to the Resources Details page and take a look at all items of the list. For each resource, you will see the call stack in the source code. Trace into the source until you see the VCL (or CLX) units.
In most cases an object is created or a pointer is assigned in the last unit. That object will not be freed or the pointer is not set to nil afterwards. So take a look at your source in Delphi and check if there is any problem.

Do not go into the Delphi VCL. So ignore all problems in units like SysUtils, System, Windows, Classes, Messages, Forms, DB, DBTables, …
Ignoring errors
OpenFileMapping
The error OpenFileMapping(4,0,”SMBuffer”) occurs because the database engine BDE gets activated. It tries to establish a connection to the SQL Monitor by opening a file mapping. This file mapping does not exists when SQL Monitor is not running and so it returns an error. This error is handled fine by the VCL of Delphi so you can ignore this error.
LoadCursor
Also the source code of Borland Delphi is not perfect. To see a list of all VCL leaks you can go to http://www.automatedqa.com/support/leaksd6.asp. When starting an application several LoadCursor errors will occur. Just ignore them.
